

Contents
From customer acquisition to revenue growth, the right metrics in marketing provide the data needed to evaluate performance, allocate budgets, and improve future decisions.
For years, marketers have relied on familiar indicators such as CTR, CPA, ROAS, conversion rate, and impressions. These metrics remain valuable. But they only tell part of the story.
A paid search campaign can show strong ROAS while losing branded traffic to competitors, or maintain a healthy CPA even though affiliate attribution is inflating reported conversions. In these situations, the numbers themselves aren't wrong — they're simply incomplete.
This article explores the marketing metrics that provide a more complete view of performance. Alongside traditional KPIs, we'll look at the hidden signals that help explain why results change, and how businesses can identify performance risks before they turn into monetary losses.
Traditional Metrics vs Marketing KPI
Many marketers use the terms interchangeably, but they serve different purposes.
Marketing metrics are used for measuring specific aspects of advertising activity performance, such as clicks, conversions, or cost per acquisition. A marketing KPI (Key Performance Indicator) connects those measurements to a broader business objective, whether that's profitable growth, customer acquisition efficiency, or brand protection.
Traditional metrics should always be interpreted within a broader business context.
| Metric | What it tells you | What it doesn't tell you |
|---|---|---|
| CTR (Click-Through Rate) | How often users click after seeing your ad. | Whether those clicks come from high-intent users or lead to meaningful business outcomes. |
| ROAS (Return on Ad Spend) | How much revenue is generated for every dollar spent on advertising. | Whether reported revenue reflects incremental growth or is influenced by attribution issues, branded searches, or affiliate activity. |
| CPA (Cost per Acquisition) | The average cost of generating a conversion or customer. | Whether acquisitions are conversions that would have happened without paid marketing. It also doesn't reveal fraudulent or manipulated traffic. |
| Conversion Rate | The percentage of visitors who complete a desired action. | Where those conversions originated, whether attribution is accurate, or whether external factors affected the customer journey. |
Looking at these metrics individually can lead to misleading conclusions. A stable ROAS may hide growing attribution leakage. An attractive CPA may be the result of affiliates capturing existing customers instead of generating new ones.
That's why many organizations are expanding the set of metrics they monitor and track the hidden performance signals that reveal a more accurate picture of campaign efficiency and business impact.
Content Marketing Metrics vs Advertising Metrics
Every marketing channel has its own way of measuring success. However, high-performing content doesn't always generate immediate conversions, just as strong paid campaign metrics don't necessarily reflect incremental business growth. The most effective way to evaluate channel-specific performance is alongside attribution quality, brand activity, and other hidden signals to understand what is actually driving results.
Content Marketing Metrics
Content marketing metrics reflect how users discover, consume, and interact with content over time. They help measure audience engagement and long-term demand generation.
Common examples include:
-
• Organic traffic: Indicates how effectively content attracts visitors from search engines.
-
• Engagement time: Shows whether visitors are actively consuming the content.
-
• Returning visitors: Reflects audience loyalty and ongoing interest.
-
• Assisted conversions: Measures the role content plays in the customer journey, even when it isn't the final touchpoint.
-
• Scroll depth: Helps identify whether readers engage with the full page or leave before reaching key information.
Advertising Metrics
Advertising metrics focus on the efficiency of paid campaigns and budget allocation and are used for campaign optimization.
Some of the most widely used metrics include:
-
• CTR (Click-Through Rate): Measures how often users click an ad after seeing it.
-
• ROAS (Return on Ad Spend): Evaluates revenue generated relative to advertising spend.
-
• CPA (Cost per Acquisition): Calculates the average cost of acquiring a customer or conversion.
-
• Impression Share: Indicates how often your ads appear compared to available opportunities.
-
• Auction Overlap: Shows how frequently your ads compete against the same advertisers.
The "Disappearing Revenue" Problem
While campaigns may appear successful according to digital marketing metrics, hidden factors quietly reduce marketing efficiency.
A good example of this comes from the lingerie brand Knix. As its affiliate program grew, the company discovered that coupon and loyalty partners were receiving credit for a large number of purchases that existing customers were already planning to make. On the surface, affiliate performance looked strong: conversions were increasing and reporting suggested healthy returns.
However, a closer review revealed that a meaningful share of commissions was rewarding demand that already existed rather than bringing in new customers. By restructuring its affiliate strategy to focus more on content and upper-funnel partnerships, Knix improved the incremental value of the channel.
A different challenge is highlighted by Partnerize, which explored the gap between attributed conversions and true incremental value. In one case, a brand initially measured around 2,000 affiliate-attributed orders using standard reporting. After analyzing the complete customer journey,
Partnerize found that affiliate activity had actually influenced more than 5,000 conversions across multiple touchpoints — not all of which were reflected in last-click reports. The case study illustrates how relying on a single attribution model can significantly distort how marketing performance is evaluated. Depending on the customer journey, channels may receive either too much credit or too little.
These examples demonstrate the same underlying issue from different perspectives. Traditional dashboards may report stable revenue, ROAS, or CPA. But they don't explain whether those results reflect genuine growth or attribution bias. Hidden factors such as brand bidding, coupon attribution, redirect behavior, or other activity can significantly influence reported performance without appearing in standard analytics.
That's why businesses are looking beyond conventional reporting. Understanding why performance changes requires monitoring the hidden signals.
Shadow Metrics: Hidden Performance Signals

Unlike traditional performance indicators, these signals don't measure campaign success directly. Instead, they help explain unexpected changes in key marketing metrics by revealing activity that standard advertising platforms often don't capture.
These signals aren't designed to replace KPIs like ROAS or CPA. Instead, they provide additional context that can uncover attribution issues, compliance violations, or traffic anomalies before they begin affecting business results.
| Shadow Metric | What it reveals |
|---|---|
| Brand overlap rate | Measures how frequently affiliates or other advertisers appear alongside your branded search ads, helping identify potential brand bidding or cannibalization. |
| Coupon attribution skew | Indicates whether coupon or deal partners receive an unusually large share of conversions that may have originated from existing customers rather than new acquisition. |
| Redirect chain density | Tracks the number and complexity of redirects before a visitor reaches the destination page, making suspicious routing or cloaking easier to detect. |
| Post-click engagement drop | Highlights situations where reported clicks don't translate into expected engagement, potentially indicating low-quality traffic, tracking issues, or click manipulation. |
It's worth noting that these aren't universal, industry-standard KPIs. Different organizations may call them differently or calculate them in different ways. However, the underlying concepts are widely applied in affiliate monitoring, brand protection, fraud detection, and attribution analysis.
For example, if ROAS remains stable while brand overlap rate steadily increases, the campaign may appear healthy even though affiliates are capturing branded traffic. Likewise, a growing redirect chain density may indicate tracking manipulation long before it causes noticeable changes in conversion rates.
Monitoring these hidden performance signals alongside traditional metrics gives marketing teams a more complete view of campaign health and helps identify problems before they turn into measurable revenue loss.
Key Marketing Metrics Threats
These issues can significantly distort key marketing metrics, making it difficult to understand what's genuinely driving growth.
| Threat | How it affects metrics in marketing | Why it's often overlooked |
|---|---|---|
| Brand bidding | Paid search metrics such as CTR, CPA, and ROAS may look strong because affiliates or competitors capture users who were already searching for your brand. | Standard advertising platforms rarely show who else is bidding on your branded keywords across different locations and devices. |
| Cookie stuffing | Affiliate conversions may be overstated, making performance appear considerably more effective than it actually is. | Attribution reports usually credit the affiliate without revealing how the tracking cookie was placed. |
| Pixel stuffing | Conversion tracking records interactions that users never meaningfully saw, leading to inaccurate attribution and performance reports. | The manipulation happens in the background and is not visible in standard analytics dashboards. |
| Cloaked traffic | Campaigns may appear compliant during review while real users are redirected to different content, distorting engagement and conversion data. | Automated platform checks often see different pages than real visitors. |
| Domain spoofing | Traffic may appear to come from trusted publishers or websites when the actual source is different, affecting traffic quality and campaign reporting. | Most reporting tools focus on volume rather than verifying the authenticity of traffic sources. |
| Coupon hijacking | Coupon affiliates receive credit for purchases from customers who had already decided to buy, overstating affiliate contribution and understating other channels. | Last-click attribution often rewards the final interaction without measuring whether it created incremental value. |
Digital Marketing Metrics: Monitoring Hidden Threats
Identifying hidden performance issues requires more than reviewing reports in Google Ads or analytics platforms. Many of the factors that influence metrics in marketing occur before a conversion is recorded or outside the platforms marketers use every day. That's why effective monitoring combines performance data with independent verification.
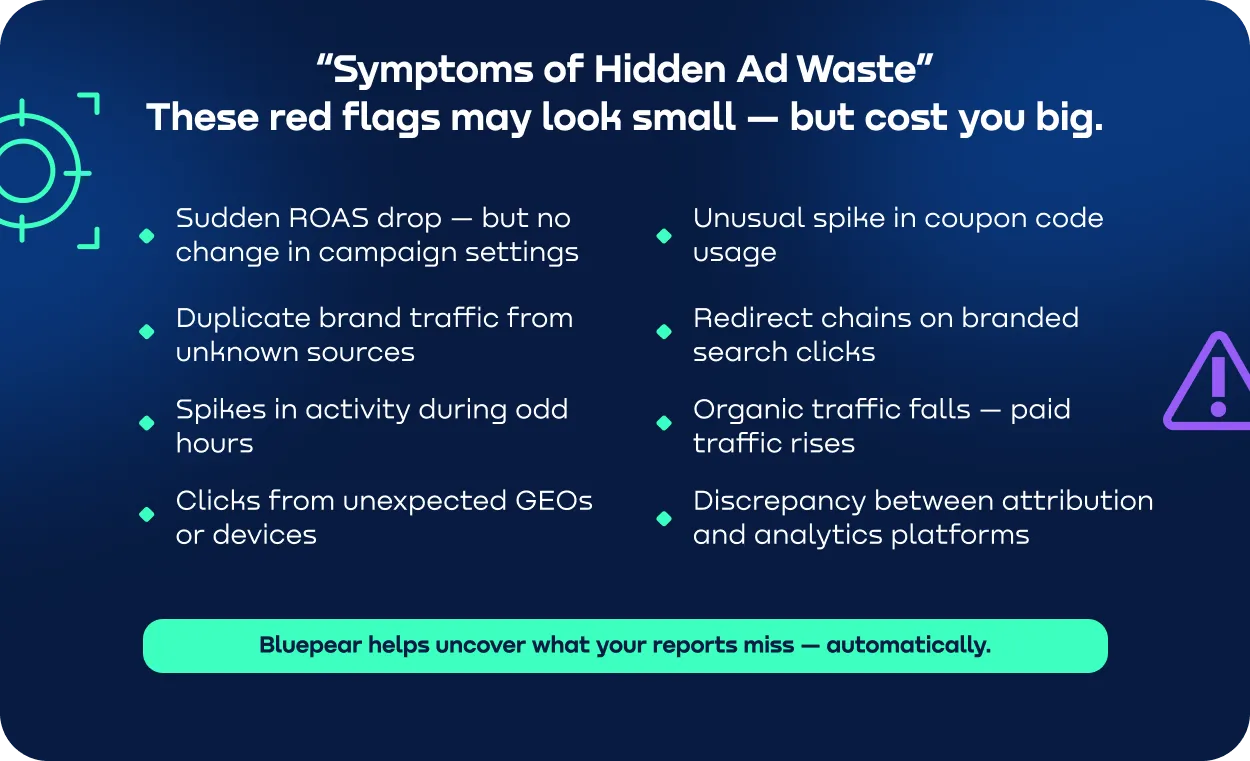
Manual monitoring rarely scales. Search results vary by geography, device, language, and even time of day. Affiliates may change campaigns within hours, while redirect behavior can be inconsistent or activated only under specific conditions. Checking search results manually or reviewing individual partner activity simply isn't practical for organizations managing hundreds of keywords, affiliates, or campaigns.
Different issues require different types of monitoring. While general analytics platforms measure campaign outcomes, identifying hidden threats often requires specialized tools.
| Problem | Tool Type | Examples |
|---|---|---|
| Unauthorized brand bidding and competitor ads | SERP monitoring | Bluepear, Adthena, Semrush Ads Research |
| Affiliate policy violations and coupon abuse | Affiliate compliance monitoring | Bluepear, Partnerize, impact.com |
| Cookie stuffing and pixel stuffing | Fraud detection & attribution analytics | Partnerize, impact.com, Affise, CHEQ, Adobe Analytics |
| Redirect manipulation and cloaked traffic | Redirect analysis & landing page verification | Bluepear, browser developer tools, redirect checkers |
| Domain spoofing | Brand protection & domain monitoring | BrandShield, DomainTools |
| Traffic quality and attribution anomalies | Analytics & attribution platforms | Google Analytics 4, Adobe Analytics, Triple Whale |
| Coupon hijacking | Affiliate compliance & coupon monitoring | Bluepear, Partnerize, impact.com |
By combining traditional marketing metrics with continuous monitoring, businesses gain a clearer understanding of what's influencing campaign performance. Instead of reacting to unexpected changes in ROAS or CPA after they've already affected results, teams can identify hidden threats early and make decisions based on complete, verified data.
How Bluepear Makes Hidden Performance Visible
Bluepear is designed to explain why that performance changes by uncovering activity that traditional dashboards don't capture.
The experience of Rhino Affiliates, an international affiliate network, shows how hidden performance signals can translate into measurable business results.
The team initially noticed a disconnect between their affiliate program rules and what was happening in search results. Although branded PPC traffic wasn't allowed, affiliates continued bidding on the brand's trademarked keywords. Rhino Affiliates also uncovered deceptive domains promoting fake offers that ultimately redirected visitors to affiliates. These activities inflated affiliate-attributed performance while increasing marketing costs and putting the brand at risk.
At first, the team relied on manual monitoring. However, search results changed constantly, ads varied by location, and some affiliate links used cloaking techniques that made violations difficult to identify and document. Without reliable evidence, enforcing affiliate policies became both time-consuming and inconsistent.
After implementing Bluepear, Rhino Affiliates automated the monitoring process. Bluepear helped Rhino Affiliates identify 105 policy violators and avoid approximately €131,000 in unnecessary affiliate payouts. In one dispute, documented evidence enabled the company to successfully challenge €11,000 in commissions generated through prohibited traffic. At the same time, legitimate branded search visibility was restored, giving the company greater control over both its affiliate program and its marketing budget.
The Rhino Affiliates case illustrates an important point: sometimes the greatest gains come from removing hidden inefficiencies, improving attribution quality, and ensuring that marketing spend rewards genuine business growth rather than activity that only looks successful in a dashboard.
To see how monitoring can influence your digital marketing metrics, try Bluepear — free trial available.
Conclusion
Marketing metrics remain the foundation of performance analysis, but they don't always tell the full story. CTR, ROAS, CPA, and conversion rate are essential for measuring marketing efficiency, yet they can't reveal every factor influencing those results.
As marketing ecosystems become more complex, businesses need greater visibility into attribution quality, partner activity, brand protection, and other hidden performance signals. Combining traditional marketing KPIs with these additional insights helps teams identify risks earlier, optimize budgets more effectively, and make decisions based on a more complete picture of campaign performance.
If your current dashboards only measure outcomes, there may be hidden issues affecting performance that remain undetected.
FAQ
Can marketing dashboards be misleading?
It is possible. Standard dashboards base their reports on the data available to advertising and analytics platforms. These usually don't reflect external factors such as brand bidding, attribution bias, affiliate policy violations, or redirect manipulation, which can significantly influence reported performance.
What are vanity metrics?
Numbers that seem impressive in reports but don't necessarily reflect business success are often referred to as vanity metrics. For example, thousands of views on social media may indicate good visibility, but not lead to profitable marketing performance.
How do you know if your marketing metrics are accurate?
Accurate reporting requires more than analytics platforms alone. Businesses should regularly validate attribution models, monitor affiliate activity, review branded search results, and investigate unexpected changes in performance to identify hidden factors that may affect reported metrics.
Can a high ROAS still indicate poor marketing performance?
Yes. A campaign can report an excellent ROAS while relying heavily on branded searches, low-incrementality affiliate traffic, or inaccurate attribution. Evaluating ROAS alongside business outcomes and attribution quality provides a more complete and objective picture.
How often should we review our marketing metrics?
Core metrics are typically reviewed daily or weekly. However, attribution quality, affiliate activity, and brand protection signals should be monitored continuously, as issues can appear and change within hours.
Why is search monitoring important for marketing performance?
Search monitoring helps businesses detect unauthorized brand bidding, misleading ads, competitor activity, and affiliate policy violations that may not appear in advertising reports. Monitoring search results alongside traditional marketing metrics provides a more complete understanding of campaign performance.

Check if Your Competitors Bid on Your Brand